Tag Archives: WP7AppHub

Xpert360 PivotViewer Blog Article Index

[Last updated: 2011-06-22]
Introduction
This post is intended to be a landing place to bring together links to our growing collection of PivotViewer articles in one place. We will update this article to reflect new blog posts and other useful links.
If you are not familiar with overriding the Silverlight PivotViewer control’s OnApplyTemplate() method then I recommend taking the time to work through the posts in the ‘Adventures with PivotViewer’ series and build up your portfolio of customization skills.
These articles are based on the version of the control shipped separately from the Silverlight 4 SDK. We will update and extend articles with information relevant to Silverlight 5 SDK as they become available. If you are already customizing your PivotViewer experience then dive right in:
Adventures with PivotViewer
PivotViewer Shorts
PivotViewer Miscellaneous
Examples on the Internet
Further things to do and resources
Conclusion
This article is an anchor page to our blog articles concerning the Silverlight PivotViewer control. There are a range of articles topics and technical levels. Some target the developer who is ready to start customizing the Silverlight PivotViewer control beyond the documented public API, whilst others show examples of what can be achieved.
Any comments or request for future topics are welcome.

Adventures with PivotViewer Part 10: Let’s do the Timelapse Warp

Introduction
Some data sets that have a datetime facet lend themselves nicely to data play back using time lapse. Sometimes playing back data like this can lead to insights that may have been missed through other visualization representations. Finding good examples is hard especially when you can argue that various trends or anomolies would also show up just as easily in more basic graph plots.
 
It would be nice if the PivotViewer filter panel was bound to data so that a timer could fire and animate the selected datetime range so automatically animating the selected PivotViewer items view in a time lapse. For now we can simulate this by manipulating the control’s ViewState and progressing the range for a target datetime facet.
 
Sample Collection Data
We decide to choose a large data set from the FAA (Federal Aviation Administration) in association with the NTSB (National Transportation Safety Board) . The sample collection covers aviation accident data from 2008 and 2009.
 
NTSB 2008 - 2009 Aviation Incidents by Severity

NTSB 2008 - 2009 Aviation Incidents by Severity

 FAA data for aviation incidents by severity for 2008 and 2009 to give you an overview. Incidents resulting in one or more fatalities are colored red.

NTSB 2008 - 2009 Aviation Incidents by Month

NTSB 2008 - 2009 Aviation Incidents by Month

FAA data for aviation incidents by month for 2008 and 2009 which shows the seasonal variation that peaks in August. Be careful not to misinterpret this as the overall volume of flights is not represented.
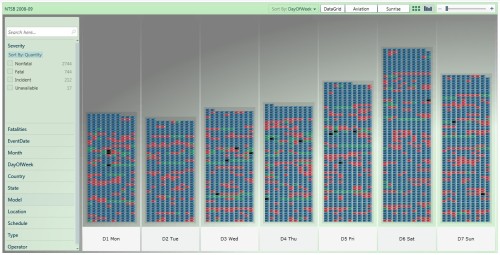
NTSB 2008 - 2009 Aviation Incidents by Day-of-Week

NTSB 2008 - 2009 Aviation Incidents by Day-of-Week

FAA data for aviation incidents by day-of-week for 2008 and 2009 which shows a modest peak on saturdays.

NTSB 2008 - 2009 Aviation Incidents for top States

NTSB 2008 - 2009 Aviation Incidents for top States

FAA data for aviation incidents by state for 2008 and 2009 which shows the states with most incidents: California, Texas, Florida, Arkansas, …

Timelapse of Incidents by State
I don’t know the real reasons for the observed trends though some are likely to be seasonal and others definitely related to holiday periods and holiday destinations resulting in increased traffic.
 
NTSB Aviation Incidents by State - Jan 1, 2008

NTSB Aviation Incidents by State - Jan 1, 2008

Starting in January 2008 the incidents are relatively light with the most in California and Florida.
NTSB Aviation Incidents by State - Jan 15, 2008

NTSB Aviation Incidents by State - Jan 15, 2008

For whatever reason the number of incidents pick up sharply for Texas as we move into early February 2008.
NTSB Aviation Incidents by State - Feb 5, 2008

NTSB Aviation Incidents by State - Feb 5, 2008

Throughout February 2008, the number of incidents increases overall but most markedly in Florida. Meanwhile the incident rate reduced in California.
NTSB Aviation Incidents by State - April 1, 2008
NTSB Aviation Incidents by State – April 1, 2008

Moving forward to April 2008 the distribution of incidents changes again with Texas ahead and Arkansas suffering more.

NTSB Aviation Incidents by State - Jun 24, 2008
NTSB Aviation Incidents by State – Jun 24, 2008

Moving forward to June 2008 the number of incidents across the states builds up and California is tops again but now followed by a peak in Illinois for what reason I do not know.

Here is a short video screen capture of a segment of the timelapsed playback.

FAA / NTSB Video Timelapse

Click to play clip of PivotViewer Timelapse

 There are a lot of additional facets to the full collections of FAA / NTSB data and many more trends and interesting visualization opportunities. Stay tuned to our blog…
 
Links 
Conclusion
This article is just a brief introduction to the possibility of playing PivotViewer collection data back as a timelapsed visualization opportunity. It is arguable whether or not this somewhat fashionable approach to visualization really gives a better insight than more traditional visualization paradigms. It all depends on whether there is really any trends in your data sets that are obscured when viewed as simple charts and graphs. Any comments or request for future topics are welcome.

Adventures with PivotViewer Part 9: Multi-Layered Trading Cards

Silverlight PivotViewer Layered Trading Cards

Silverlight PivotViewer Layered Trading Cards - click to view video

Introduction
Adding multi-layered trading cards is a feature enabled by the XAML data template trading card support for the version of the Silverlight PivotViewer control that will be distributed in the Silverlight 5 SDK. This article shows you how to implement a similar effect in the previous version of the control.

If you are new to our blog then you may care to take the time to work through the other posts in this series and build up you portfolio of PivotViewer customization skills.

Deep Zoom Collections and Images

Silverlight PivotViewer Product Catalogue collection

Silverlight PivotViewer Product Catalogue basic collection images

The easiest way to achieve this effect is to generate a full set of deep zoom collection imagery for each desired layer. Also generate full sets of deep zoom images for the desired layers of the trading cards.
 
Simply merge together the folders of the image layers according to your trading cards layer designs. By default the layers 0 to 7, equating to deep zoom folders 0 to 7, are used for the deep zoom collection imagery for the lower resolutions. Only the layers 8 and above are used at runtime by PivotViewer for the individual deep zoom images: folders 7 and below can be deleted and do not need deploying.
 
PivotViewer Low-Res Trading Card Images

PivotViewer Low-Res Trading Card Image transition

 
It is important that all source images for a trading card are the same height and width. The PivotViewer Excel tool is useful for trying this as you can simply copy the Excel spreadsheet and replace the trading card images.
 
I would suggest that you use common low resolution images for the zoomed out top layers of the deep zoom pyramid. For the primary theme choose a facet category with fewest values that can be represented by color. Choose images that represent a secondary attribute such as a category-type facet. By following this approach the users can quickly and easily work with the collection trading cards at low resolutions by visual association of color and category icon.
 

PivotViewer Hi-Res Trading Card Images

PivotViewer Hi-Res Trading Card Image Transitions

 
At the other end of the scale with the highest resolution images you probably will want more information, mini-graphs, etc. These images can be captured from a simple custom tool that uses a XAML data template bound to the collection data. If you do this you ought to be able to reuse your code with the vNext version of PivotViewer.
 
PivotViewer Trading Card

PivotViewer Trading Card Hi-Res from XAML

 
Further things to do
Conclusion
This article is just a brief run through that introduces multi-layered visualization of Silverlight PivotViewer control trading cards. It targets the developer who has already started customizing the Silverlight PivotViewer control in preparation for the next version scheduled to be distributed with the Silverlight 5 SDK. Any comments or request for future topics are welcome.

Adventures with PivotViewer Part 8: Filter pane tooltips

Introduction
Adding tooltips to the left side filter pane not surprisingly requires the use of a customized PivotViewer control:
You should be familiar with the following line of code to get the CollectionViewerView from earlier blog posts and samples.
CollectionViewerView cvv =
((CollectionViewerView)((Grid)
this.GetTemplateChild(“PART_Container”)).Children[0]);
If you are not familiar with this then I would recommend taking the time to work through the other posts in this series and build up you portfolio of PivotViewer customization skills.

Locating the UI Elements and attaching ToolTips
Tooltips can be set on controls in code behind using the ToolTipService. Normally you might use the ToolTip attached property of the ToolTipService class and the ToolTip control in your XAML.
The flow of the code goes something like this:

  • Locate the “PART_FacetPane” in the tree. This is a CustomAccordian control.
  • Locate the CustomAccordianItem‘s ( == facets)
  • … under each item is a FacetCategory control to find the facet category name.
  • … use the TooltipService to set custom tooltips on the CustomAccordianItem‘s
FilterPaneView FPV = (FilterPaneView)PivotViewer.CollectionView.FindName(“PART_FilterPane”();
CustomAccordion FacetPane = (CustomAccordion)FPV.FindName(“PART_FacetPane”);
StackPanel itemsHost = (StackPanel)FacetPane.GetItemsHost();
for (int nitem = 0; nitem < itemsHost.Children.Count; nitem++)
{
CustomAccordionItem item = (CustomAccordionItem)itemsHost.Children[nitem];
// tooltip for facet category header
stringtooltip;
string facetName = ((FacetCategory)item.Content).Name;
switch(facetName){
case “AppCount”:tooltip = “Count of applications in the Marketplace”;
break;
case “Ranking”:tooltip = “Overall ranking in the Marketplace”;
break;

ToolTipService.SetToolTip(item, “Facet:\n”+ tooltip);

If you take a look at this set of pivot collections, visualizing the WP7 Marketplace, you will see facet tooltips are implemented:
WP7 APP HUB
FAQ
If you want to try out the code there are a few things to watch out for. You will not be able to set the tooltips before the collection event CollectionLoadingCompleted has completed and exited. If you wrap your tooltip code in a function then you can call it from this event using the control’s dispatcher:
this.Dispatcher.BeginInvoke(SetToolTips);
You will need some internal Microsoft Pivot references and usings too. Depending upon the extent of your other customizations you will need these:
using System.Windows.Pivot;
using Microsoft.Pivot.Internal.Controls;
using Microsoft.Pivot.Internal.Model;
using Microsoft.Pivot.Internal.ViewModels;
using Microsoft.Pivot.Internal.Views;
Further things to do


Conclusion
This article is just a brief tutorial that includes the key features of using the tooltip service control in code to attach custom tooltips to visual elements of the Silverlight PivotViewer control. It targets the developer who has already started customizing the Silverlight PivotViewer control beyond the public API. Any comments or request for future topics are welcome.

Visualization of the Windows Phone 7 Marketplace with PivotViewer

We had to take a break from blogging to allow us to catch up on work commitments. Meanwhile we have some PivotViewer linked collections deployed at the WP7 App Hub website. These collections are only a place holder for now whilst the behind the scenes infrastructure is finalised for automated build of the dynamic JIT collections for the Windows Phone 7 Marketplace applications.

We are aiming to bring some different and alternative marketplace views and give more prime time for neglected and suppressed application areas such as non-English applications, on-going new releases and indie games.

The marketplace is fragmented and difficult to navigate but not for much longer…